- Agrykola was defeated with Strava included 43877 times for over 1200 people, and the driveway to Słomczyn 14848 times for 928 people
- Słomczyn was the first to be officially received by Henning Andersen on May 7, 2008. The next rehearsal took place just over half a year later by Pi.No. The best result since then has decreased from 51 seconds to 24s. Perhaps you would like to compare second by second with Adam Ż, who holds the current record? Or maybe you just want to cheat and use the best modifications to beat the best time?
- Have you ever wondered how many people in Amsterdam move with Strava by bike between 8 and 9 am or how many people are traveling in a given month on the route under your home?
- Did you know that since 2012, the number of people who drive Agrykola and Strava is growing twice with each subsequent summer?
- Have you ever counted how many kilometers you have defeated in which city or region? Or maybe you would like to get such a set with one click?
- Perhaps you would like to print a nice poster with your routes traveled over the last year?
Below are a few ways to easily cover your data left in Stravie for completely unnecessary purposes.
Strava Segment Details, meaning everything about Góra Kalwaria
http://www.jonathanokeeffe.com/strava/segmentDetails.php
Analysis of a single segment: the page as a parameter takes the segment ID from Stravy or its full address, after which it spits out all possible data. From the full history of KOMs (the first three places) and their changes over the years, to the statement: the number of attempts / the best time / average time per cyclist, presented on the list of ALL trials of ALL riders. The amount of data is overwhelming, because the table can create, for example, a list of all trips of a given segment, that is tens of thousands of items. In addition, a little bit of all kinds of charts, for example: the Lipkowska segment (famous Góra Kalwaria on the Gassy round):
http://www.jonathanokeeffe.com/strava/segmentDetails.php?segmentId=httpwww.strava.comsegments1499492
The number of driven drives in this segment and the number of people who have overcome it in recent years. You can see that either the riders are coming or Strava is becoming more and more popular (or, most surely, this and that)
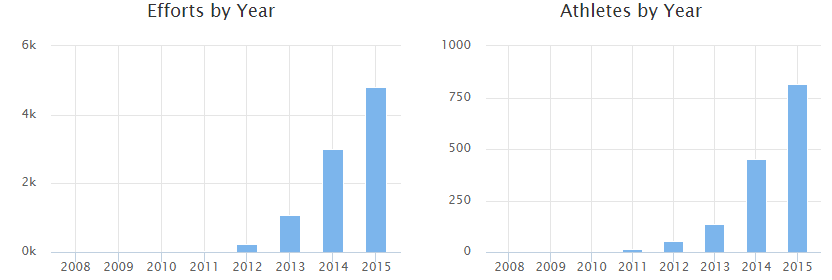
The number of cyclists defeating this segment in the following months:

Strava Multiple Ride Mapper, which is where I was, where I was shooting?
http://www.jonathanokeeffe.com/strava/map.php
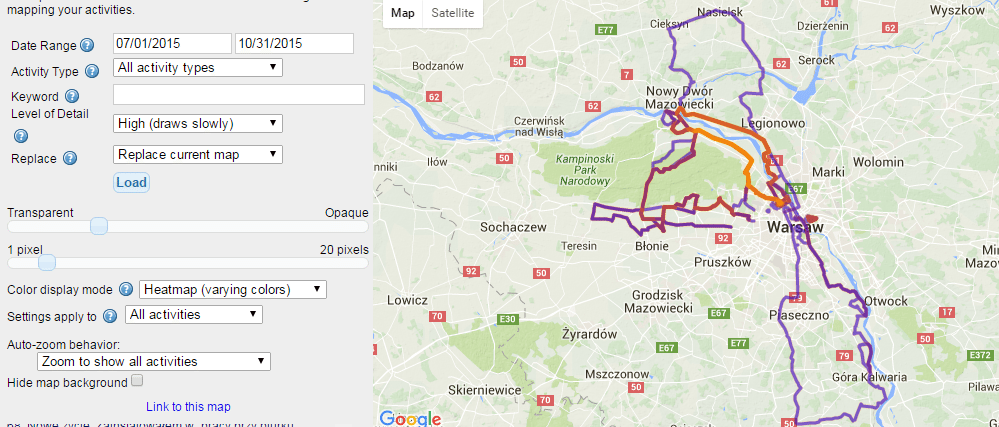
The application draws us personal Heatmap, i.e., mark the places where we performed activities on the map. We can choose a few filters, such as dates, type, keywords and a small possibility to change the way of drawing. Works for any number of data automatically downloaded from Stravy, but over 100 starts to load the browser quite seriously. As you can see, when it comes to driving around Warsaw this year, I was not very revealing.
Strava Annual Summary, or what did I do in 2008?
http://www.jonathanokeeffe.com/strava/annualSummary.php
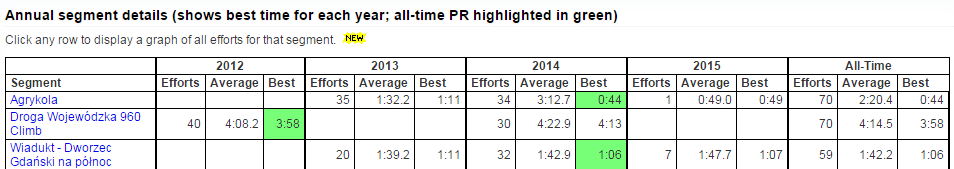
Very nice annual summaries of Stravie activity. Apart from the standard tables with distances, we also have them divided according to everything we can: the type, the place where they started, the region, the average slope (!), The longest activities, some colored charts and all this broken up for the next years / months / bikes and modestly, but look clearly presented. Magic, here are examples:
The list of segments that we have traveled over for years and achieved times - I have thousands of them. In 2014, it was 1216 segments defeated in total 3530 times.
Segment of activity breakdown by region (it is important to use Strava always in one language, otherwise we will separate data between eg Pomorskie - for PL, and Pomeranian for EN).

Strava Local, or what to visit
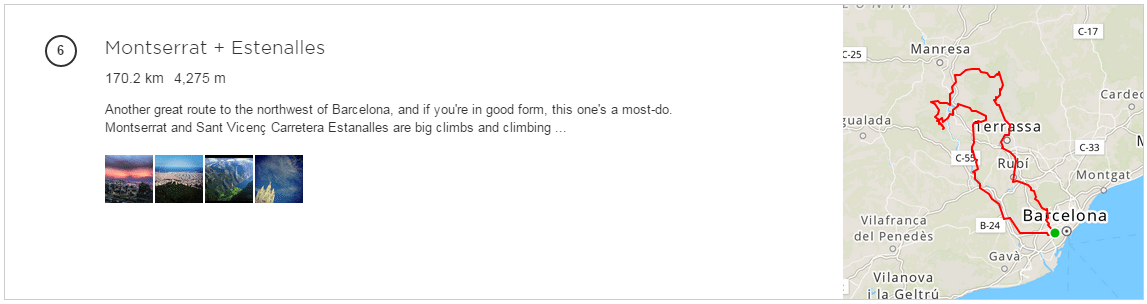
Only the 12 largest cities, but in my opinion it is the best thing Strava did and if it is developed it will become a hit for me. I've always wanted to create a portal where you would choose a place and distance to go and he will offer me a route. But not as it is on MapMyRide - one thousand five hundred routes, only a few of the best. This is what Local does: we choose the city, we choose whether we are going, whether we are running and we get a few obligatory proposals together with a short description and photos. PERFECTLY.
Strava Helper
https://addons.mozilla.org/en-US/firefox/addon/strava-helper/
An addition to firefox that implements some great features. First of all, primo, ultimo, Wspanissimo: BUTTON GIVE KUDOS TO ALL. At a time when Kudosas have lost their meaning and are given away to the left and right for just about anything, a button to please our friends will save us a lot of time. One click (on the screen at the top left) and all visible activities get Kudos (ie Stravowy lajka)

Add to this the nice additions like removing from the screen all notifications about premium services or social media, additional buttons transferring to other sites, endless scrolling list of activities of our friends (no longer need to click every "more"), pinning the upper beam, to go with a scroll and many, many more. All of course, configurable in the "Extras" tab in the browser.
Strava Sauce
https://chrome.google.com/webstore/detail/strava-sauce/eigiefcapdcdmncdghkeahgfmnobigha


Useful for training with power. It sets us the best intervals (5s, 15s, 1min ....) In terms of the generated watts and at the same time indicates how we are falling out against others.
Stravistix for Strava
https://chrome.google.com/webstore/detail/stravistix-for-strava/dhiaggccakkgdfcadnklkbljcgicpckn
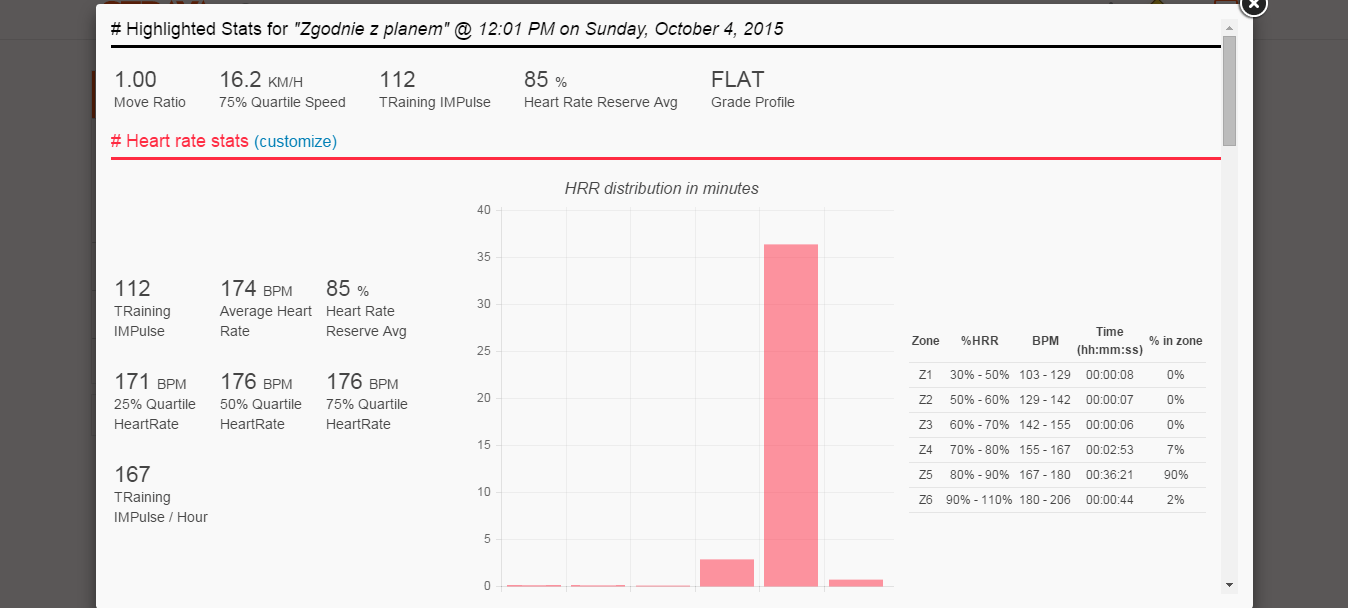
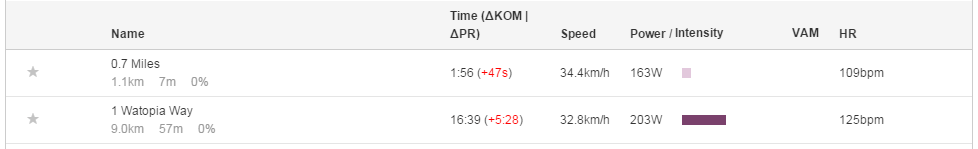
Another addition to Chrome, which develops the amount of data visible in Strava, power-related graphs, heart rate, loss to KOM on the list of segments, direct links to view activity on another site, hiding information on challenges and routes created in the feed , and all of this is modifiable in the options menu with an extremely nice interface.
Strava Enhancement Suite
https://chrome.google.com/webstore/detail/strava-enhancement-suite/
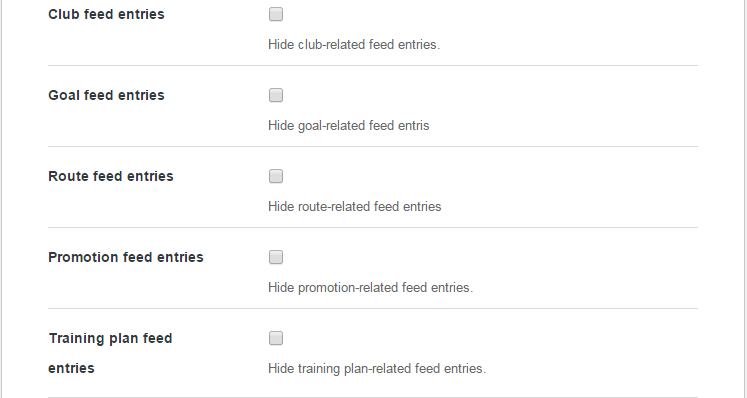
The third in a series of great Chrome add-ons that allows similar actions to the previous ones. We can hide any type of entries in the feed (eg discard simulators and challenge), the possibility of changing the default settings and a few graphs. Generally a lot less possibilities for data presentation, however, more modifications in terms of display.
Canyon Beyond Limits
http://www.canyonbeyondlimits.com/connect
A tool straight from Canyon, which lets you see what your heaviest training / race looks like against the background of the last 30 activities. The results are presented graphically using triangles, and some numbers. In fact, I do not know why and what to use, but it looks very nice. I'm not cool for triangles and I do not quite do it, but from what I saw on Facebook, people like it and share results (or maybe they only do it because sharing the result takes part in the competition).

Strava Labs
Stravy's laboratory will probably all be found. Official projects are added from the Stravy developers, based on the data contained in their databases. The most interesting are:
The Roster, which indicates our most faithful companions during the activity, counts how many people we have been practicing and how the amount of lonely / group activities is distributed. In my case, the balance is the most important:

Clusterer, which collects information about the largest, common events in a given area, with the indicated length and type. In Warsaw, when it comes to cycling, it is clearly visible that PB Wawer and the Rond route are dominant:

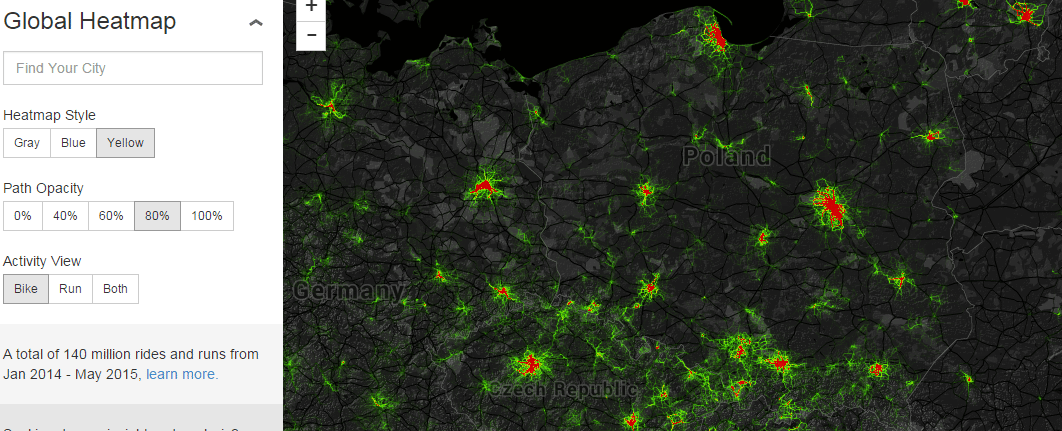
Global Heatmap, or a collection of all Stravie activities in one place. You can see where the most people use this application and which routes are most often overcome:
Flyby, which is an obligatory tool for post-competition analysis. It lets you trace how the fates of each of the cyclists took place, showing them as circles moving on the map.

For this map, aggregate photos taken by users, places of the most frequent stops, maps of KOMs or navigation errors.
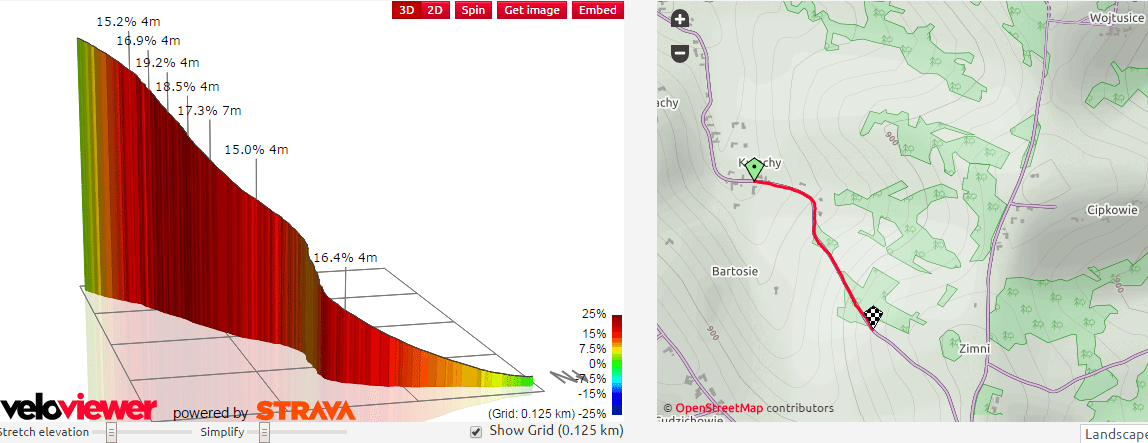
VeloViewer, i.e. I pay so I have ... or I do not have.
VeloViewer is supposedly a combine, so you have to pay for it - 10 pounds a year. Does it make sense? Nothing to me. Nothing at all. The free version is limited to 25 activities and 250 segments. On good day, we get a dashboard with our records, the best results, the result of VeloViewer, which is calculated on their basis, some stars for achievements and some information about our best segments and the equipment we use. In the next tabs, there are tables with everything possible and maps showing where we were and what we were doing. From the more interesting options, we get access to the Strava Challenges Trophy Cabinet, which includes all our completed challenges in Stravie and those that are currently underway with the percentage progression. In addition, we can generate quite a nice graph of segment surpassing and that's basically enough, nothing that would not be in free solutions.
Digital EPO, or why inject EPO into the blood when it can be used for .gpx?
As it is not difficult to guess by name - the application is forbidden. It allows you to modify the activity trace by the given value. We have options available: increase speed, lower heartrate, increase climbing. The modified track on Stravie is quite easy to know what I was writing about HEREso I do not recommend it. I only emphasize that it is possible and it works in a very simple way.

Sisu, i.e. drive and draw
The idea is simple and rather unhelpful, but original. The application collects all of our activities of a certain type within a defined time interval and draws from them ready-to-print graphics or sharing on a Facebook page. I hope that the project of the future will develop and the author will add more templates, because for now we have only two: all traces collected in one place or a pie chart showing the duration of subsequent activities with an aesthetic summary at the bottom. Of course, the activities are automatically loaded from Stravy or RunKeeper.

Strava Insights, I do not need any curiosities
Do you know where and on what day the most bicycle activities were registered? Mother's Day, May 10, 2015 in Amsterdam was record-breaking: 21.824. It is also a city that reigns in the ranking "activity during lunch"- 1 out of 4 rides takes place there between 11-15. Some statistics that are completely useless for the twelve largest cities in the world (unfortunately Warsaw is not) given a very nice, clickable form.

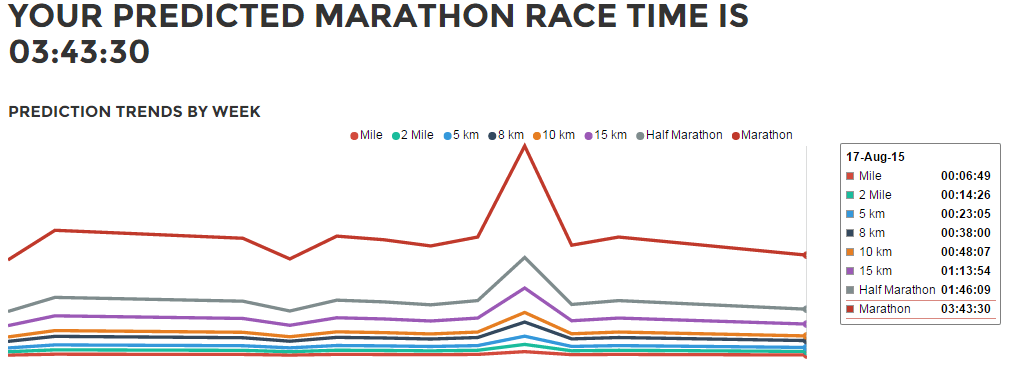
RacePredictions, or how fast would I run if I wanted to?
Site that based on data extracted from Stravy (the fastest running activities and segments) prepares us with predicted times at given distances in accordance with the Peter Riegel formula. Basically, the disadvantage is that sometimes it works, and sometimes it does not work and they had data over and over again, so below printscreen know people, because it did not work for me.
Sranks, or who is the biggest Kozak in the city?
Rankings of the largest Macho in the city - unfortunately, so far no Polish. Ranking of people who have a larger number of "segment points". Depending on the results obtained on segments in the city, which are scored differently depending on their difficulty / length, a list of glory is created.
