A word of introduction.
I draw my knowledge from internet gigabytes, kilograms of books and hours of lectures. The Internet is similar to the fact that a high school student with a nickname "DoctorProfessorDoktor67" argues on medical issues and, for example, a physiotherapist with the nickname "Krzysio_30", the art is to get to know who is who. I present all the information below with a purely amateur approach - we found it on the net and check how much it can be repeated.
Before you start, check if you are tired
Do you know the feeling that you wake up in the morning and do not know if you are tired? Probably not, because this question is quite stupid ... in the morning you are always tired, because work, because the race, because the party, because something. So how do you know how the day will be going and how to plan a week to get the max out of it?
In addition to your own well-being, there are some objective ways to assess your fatigue:
Relaxed heart rate
One of them is the daily control of resting heart rate. It's best to do it in the morning before we even get out of bed and we're upset. Sleeping in the bar is not the best idea, a pulse watch is still not a widespread gadget, so how to do it? There are thousands of applications in the App Store and the Google Play store that measure your heart rate using your phone. Always having a device next to the bed (because the alarm clock) after some time, the first morning instinct is control. Launch the application, put your finger to the flash (flashlight) and wait. The result after a dozen or so seconds is saved in the memory and marked on the graph. In short: the lower, the better. After a few weeks, we should notice a correlation between fatigue and heart rate.
If it grows by more than 10% it can mean that something is wrong (illness, stress, dehydration, fatigue etc.)
If it's falling well.
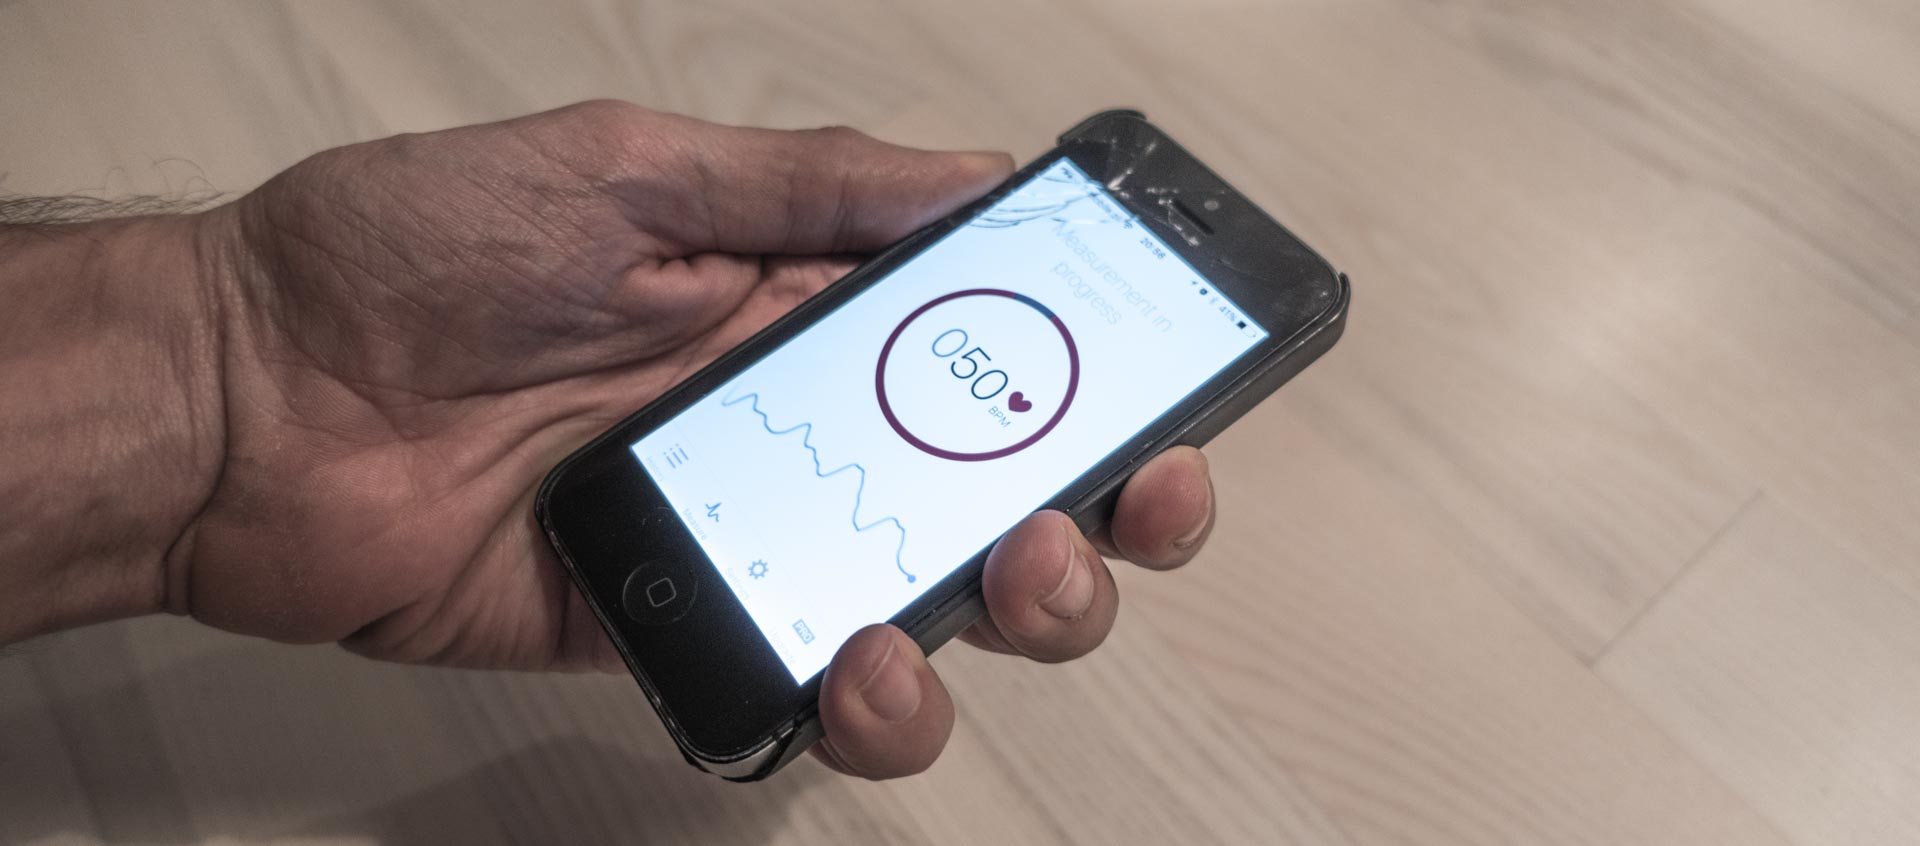
Chart na Strava / Training Peaks ...
A slightly more scientific approach is the assessment of fatigue based on previous workouts. This corresponds more to the state in which we should actually be, than the one in which we are. Each more advanced training tool has this option. In Stravie, it is Freshness & Fitness. I have to use here unfortunately the graph from the internet, because mine is incomplete. I do not take my heart rate monitor on most non-workout outings, and I have not gotten the power on the road yet - from the perspective of time I regret that I did not always ride with my heart rate.
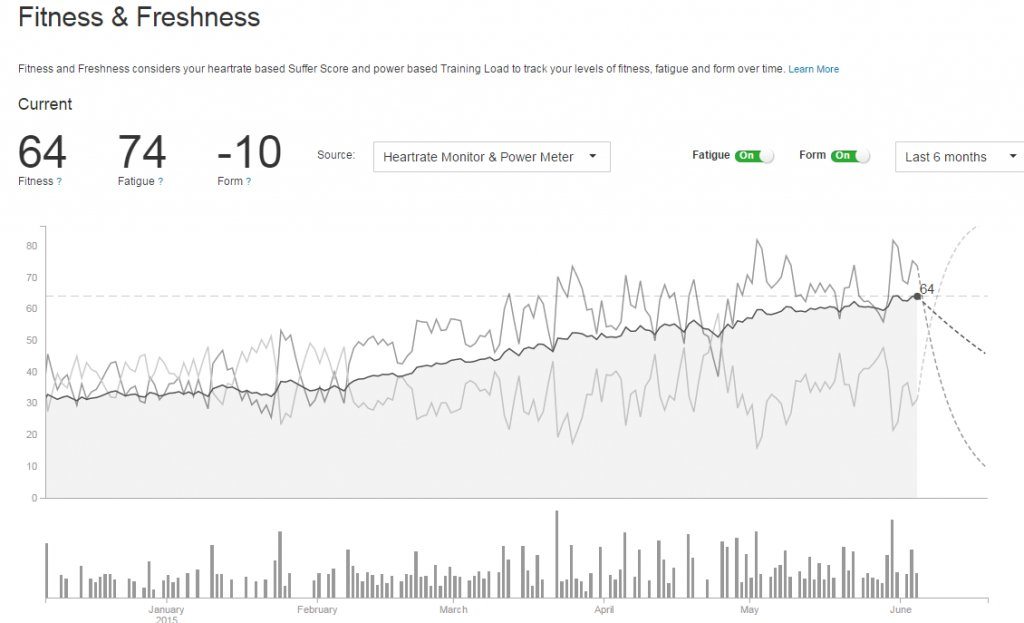
There are 3 lines on it:
fatigue - short-term fatigue. Some hard training in a row and our fatigue will go high. (for Strava supposedly last 7 days)
Fitness - accumulation of training units, which in effect build our training on a scale of about 1-3 months (for Strava supposedly 42 days)
forms - difference between the above values. According to this line, one should be able to determine the quality of our driving on a given day. A high level of fitness (fitness) along with low fatigue should give a good disposition. Here the concept appears tapering: taking advantage of the fact that the fatigue level drops much faster than training, by reducing the training volume before the start day, we will achieve an exceptionally high value form.
According to unacknowledged information from the Internet, it is best to keep the form between 25 and minimal negative (assuming, of course, that we have been putting on the training for a long time), and during the preparation period on negative values up to minus 20. After some time, it is easy to notice your correlations between the leg and numbers.
Similar indicators precursor to this chart: Peaks training:
ATL, as fatigue, CTL as fitness and TSB as forms.

Adding to this information about individual trainings marked with red and blue dots as TSS and IF (which I described here: How to train in the winter - cycling in numbers: TrainerRoad) the above, exemplary chart should be already relatively accessible.
Astrand test
Oxygen ceiling (VO2 max) - the ability to absorb oxygen through the body. It is one of the most popular indicators of physical performance, especially aerobic fitness. Often, the severity (intensity) of effort is determined in percentage of VO2 max.
Wikipedia
How do you check how much oxygen can absorb our body without pumping a syringe through the nose?
[pullquote] VO2max is 80% genetics, 20% training. [/ pullquote]
We go for 7 minutes. The test is done with such a load that the heart rate at the end is between 120 and 170 beats per minute. In our case, it's 200W minimum.
At the end of 5, 6 and 7 minutes, we measure the heart rate and note - measurements should not differ by more than 5bpm. If they differ, the test should be performed again with less load after 15 minutes of rest.
Next, mark our pulse on the left side, on our right side our watts (kilograms are taken into account only in the test with stepping up - without a bike) and at the intersection of the drawn line with the green line marked VO2max we get our result.

A large and more detailed and easier to select table is available at: http://www.brianmac.co.uk/documents/astrandnom1.pdf
Then we apply the correction for age according to the multiplier:
| age | multiplier |
| 15-25 | 1,1 |
| 25-34 | 1 |
| 35-39 | 0,87 |
| 40-44 | 0,83 |
| 45-49 | 0,78 |
| 50-54 | 0,75 |
| 55-59 | 0,71 |
| 60 | 0,66 |
To convert the result to a slightly more friendly format, divide it by our weight and multiply it by 1000.
For comparison, the results of professionals (for http://blog.trainerroad.com/how-vo2-max-work-makes-you-fast-the-science-behind-it-all/)
- Greg Lemond (m): 92-94 mL / kg · min
- Lance Armstrong (m): 84 mL / kg · min
- Miguel Indurain (m): 88 mL / kg · min
- Chris Froome (m): 84.6 mL / kg · min
- Flavia Oliveira (f): 76 mL / kg · min
- Oskar Svendsen (m): 97.5 mL / kg · min
- Joan Benoit (f): 78.6 mL / kg · min
and the highest confirmed results in history that I found:
97.5 mL / kg · min Oskar Svendsen Cycling
96.0 mL / kg · min Espen Harald Bjerke Cross country skier
Example:
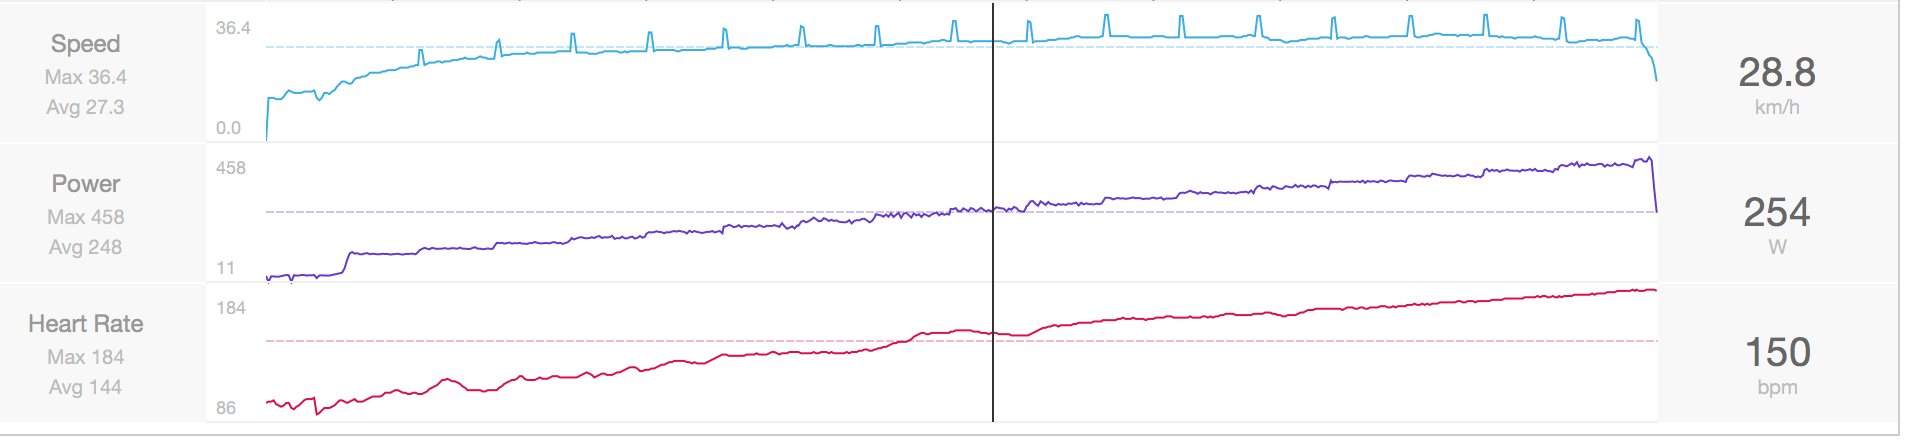
7 minute test at 200W (1200 Kp / min). We dump the entry into Stravy and mark the last 3 minutes:

The power agrees (according to the rule of the least acceptable amount of work), the average heart rate is 132:

On the normogram, we put away the heart rate of 132 and 200 watts and combine the straight line. At the intersection, it exceeds a little over 5.0 liters per minute. Last year, at the Sportslabie survey, the result came 5.1, so very similar. Maybe a coincidence, maybe not - on the basis of a completely inadequate sample of 1 cyclist, I say that the test is very accurate ... on the other hand, measuring my maximum heart rate by the popular 220-year method also results in a +/- 2 strokes, so maybe I'm just totally normal. Why do we need this result? Basically for nothing :)

Conconi test
Conconi's test is a different story - not very pleasant and definitely not happy ending. This is the kind of test we most often encounter on professional research. The principle is simple: we move from around 100 watts and increase every certain time.
We did it every minute, plus 20 watts, in Sportslab they added 30 watts every 2 minutes. There are many ways. We are going to refuse. It is quite easy to notice this moment: everything gets black, legs stop spinning and lungs appear in the throat. The Internet talks about 5-7 deaths for every 100,000 tests (ACSM, 2010), mainly because of various hidden heart defects, so I do not recommend doing it without prior cardiac and loneliness tests. To start you will need a heart rate monitor and trainer (type smart trainer, i.e. one that imitates the load).
First, we prepare a "route". Programs in which we can do this is certainly mass, but we choose two:
Zwift
Very uncomfortable. Each of the posts must be set manually. Dragging the sliders is annoying like nothing else: if you want to set a 100W you will definitely be 3 minutes aiming with the mouse, reaching a change in the value of 99W and 101W - similar to the following:

Trainner Road
Trainer Road is much more convenient. We copy Słupski, enter the values from the finger, everything takes up to 5 minutes. The problem is only the fact that we do not use the absolute value of watts, and the percentage of FTP (which can reach a maximum of 300). So we set FTP temporarily to 200W, so that it easily counts and we increase each of the posts by 10%. We're going to the corpse.
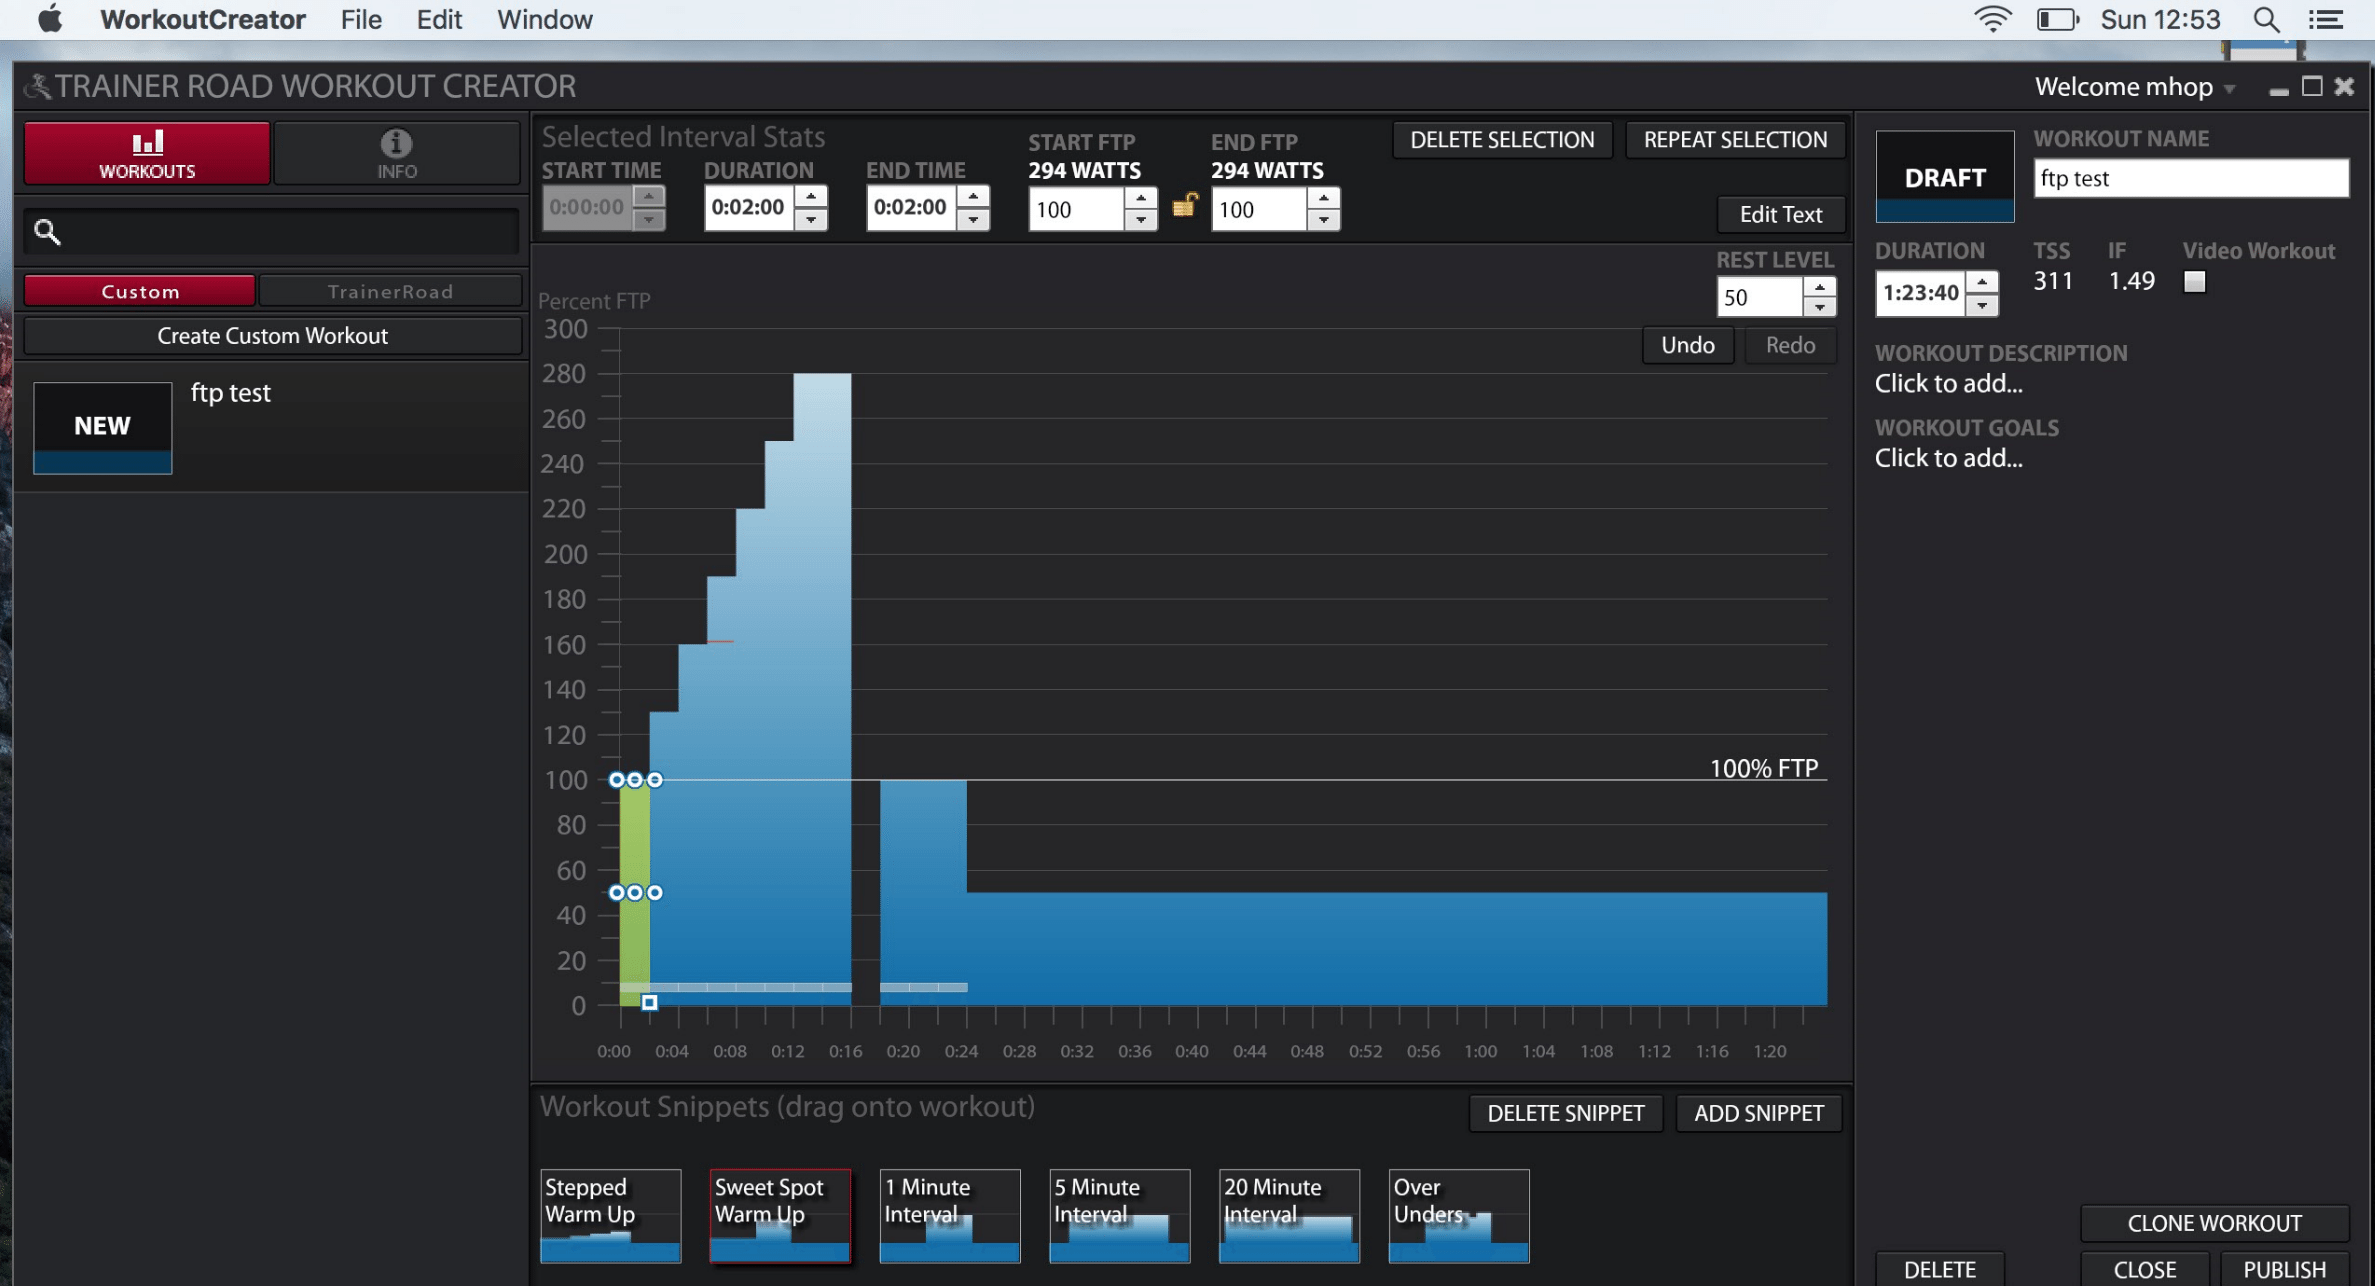
The analysis of the results gives us nothing. The FTP threshold we are looking for should be in place of the heart rate curve collapse. Good luck in looking for this collapse on the chart. Even if I know that my threshold should be around 300W I will not find it:
And basically even worse. Looking at the graph I would be sure that the threshold is around 250W-260W. Putting the heart rate from every last second on the given load in excel, it looks a little better:

It is clear that the breakdown occurs around 8 minutes ... or 2 minutes too early.
And here comes the problem - home tests usually end up around HR 180, tests in places designed for this purpose reach me to about 192 - this difference suggests that homemade measurements are about the edge of the ass (the difference above 10 gives information that the test did not go as it should). Despite the same rest, I can not motivate myself to the same level of effort. Does it affect the curve collapse? I do not know.
If there is no clear breakdown of the pulse curve (and this happens in 30-40% of people), the best solution is to measure the blood lactate. We borrow the device from a friend, buy needles and measurement strips and prick. We prick so many times that at the end of each level of difficulty, pour blood from the finger or ear on the petal. Unfortunately, we have not been able to carry out this test at home, because although we live in the capital, the availability of straps is very limited to the devices we could get.
In the case of lactate, the threshold is where the values start to grow suddenly. As on the example of my research from the past:

Even though here, I do not know if I would point precisely this place, which should fall to 250W. It turns out that with such limited knowledge as mine, conducting such tests is pointless. It's better to use more methods.
Having a designated FTP, we can easily check the zones in which we should practice:
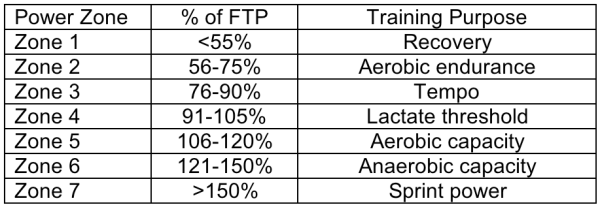
The test, however, provides one more important information: maximum aerobic power - in short MAP (Maximal Aerobic Power). This is the last level of load that we managed to keep in full. Of course, the results may vary slightly depending on the method used to increase the load. Official recommendations of cycling associations can be found in the link below (also recommendations for warm-ups):
Based on these watts, we can set training zones:

FTP from Stravy
If we have a bike with power measurement or we race seriously (in the troupe) on the trainer - however stupid this sounds, we can help us with the Power Curve from Strava. For me, this will not work, I ride without power in the season, and when it comes to the Race in the Room, I never get to such a state as in the yard:
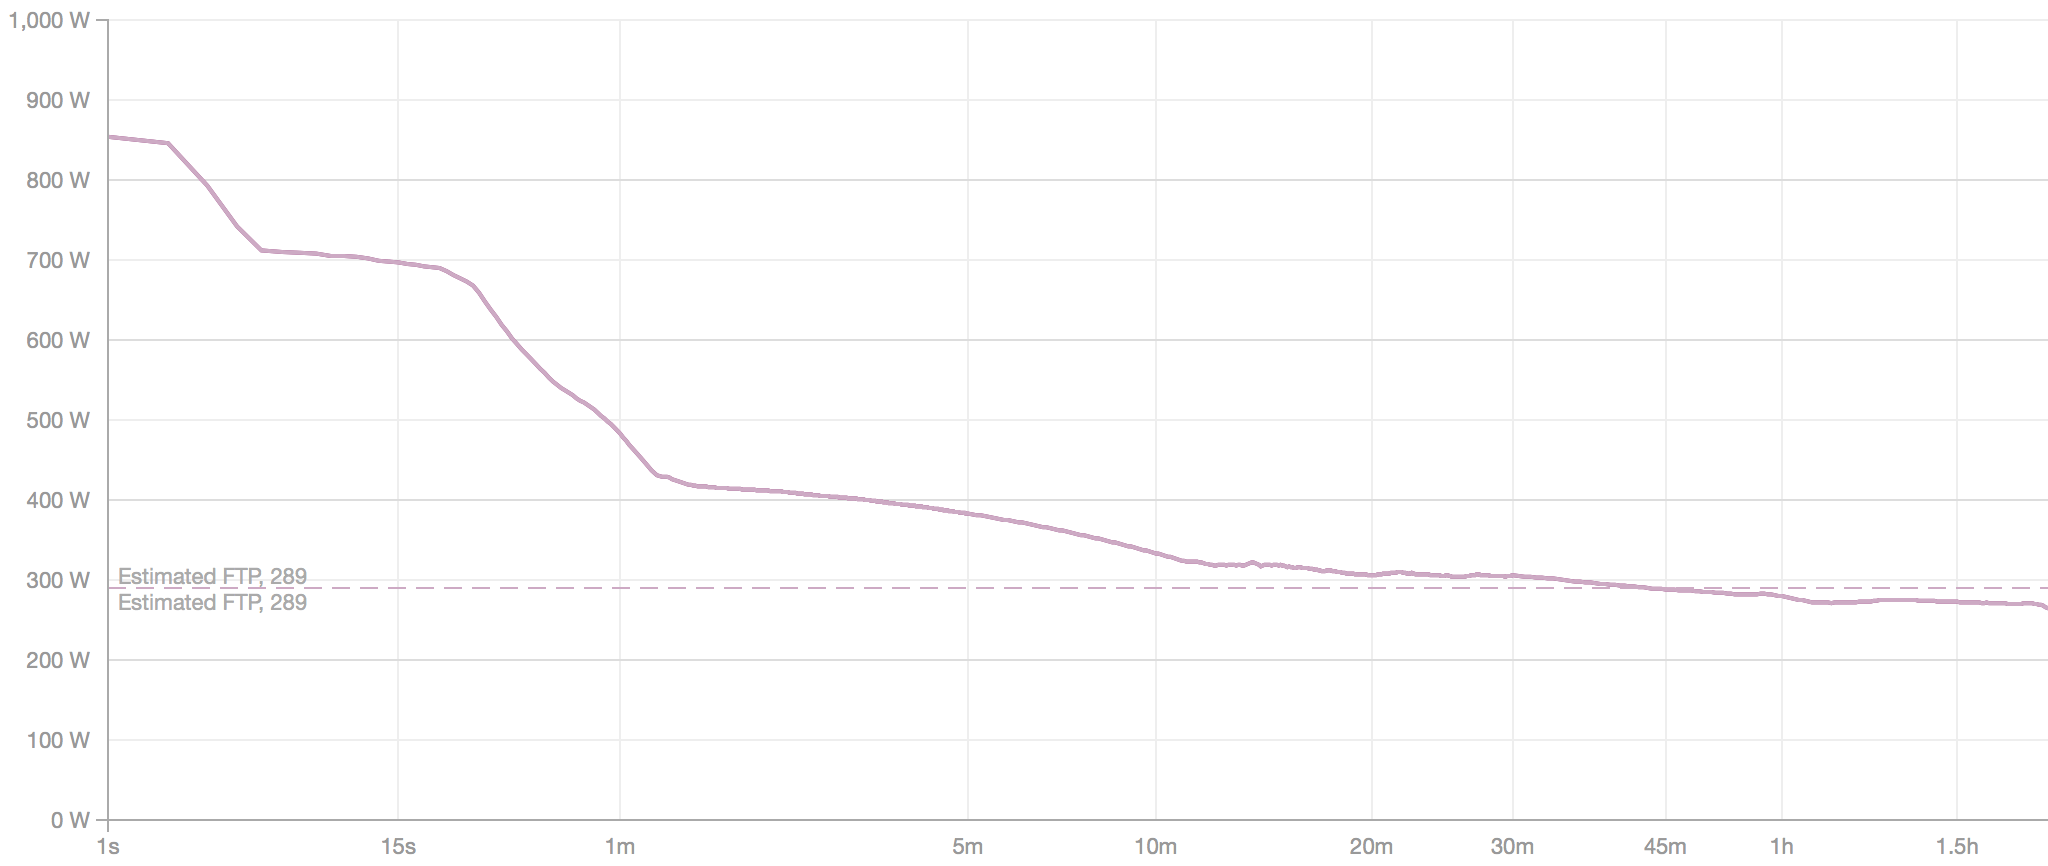
The chart itself is very cool, because it shows the maximum watts that we can maintain for a given time, and then calculates the threshold on this basis.
FTP determination empirically
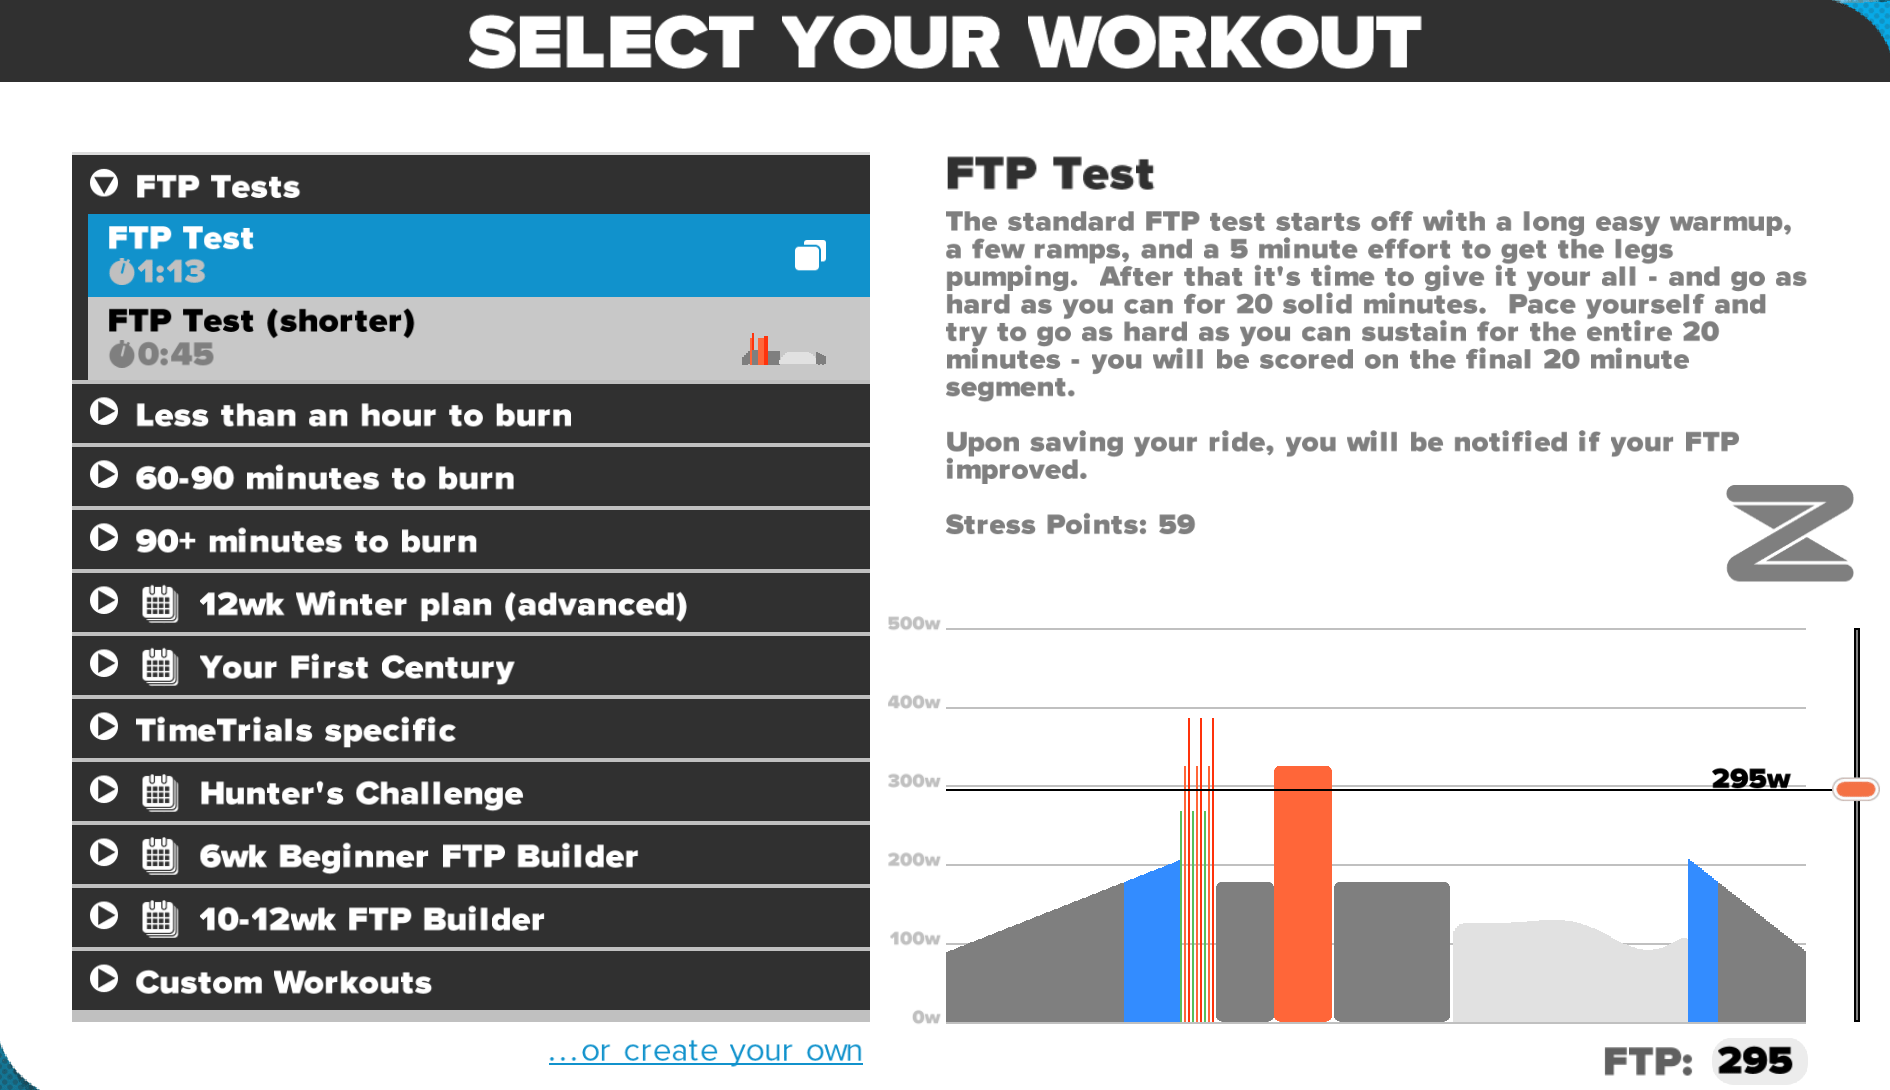
My favorite method. FTP tells us about the power that we are able to maintain for an hour and not die (that is, formally, because psychic death is certain), so the easiest way is simply to check how much we can actually generate wat hour in 60 minutes. Wise people, to save us a bit of torment, they came up with shortened versions: 2 × 8 minutes and multiplying results by 90% or 1 × 20 minutes and multiplication by 95%. The basis here is to maintain a steady pace throughout the duration of the test - it requires a bit of self-denial and experience, but the results are definitely the most accurate and I base all winter training on it.
If anyone has reached reading up here, I am sincerely sorry. It turned out that the tests at home are quite pointless and in fact the best thing that we can do is to determine the threshold of FTP grate, a proven way of driving 60, 2 × 8 or 1 × 20 minutes and putting your workout under such designated power :)
For better humor, a table with average watts per kilogram:
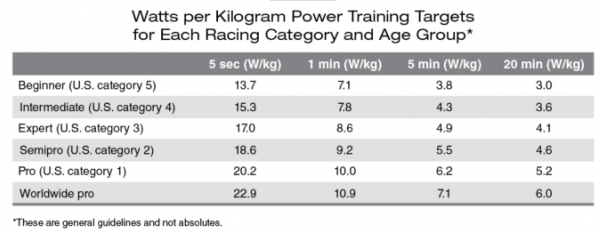
It is clear from this that if we want to chase with Cavendish for sprints, we need to produce a minimum of 20W per kilogram, and to fight for TdF produce 6W / kg for 30-40 minutes ... several times ... during the day.
The best thing about the FTP test is that we can do it without measuring the power. Applications pretty well estimate how many watts we do, but it does not really matter - it would be important for the result to be repeatable during subsequent rides.